Work report of the use case „Integrated data analytics and collaboration in order management” at ERCO (UC3).
Target of the third use case is, to implement predictive analytics supporting collaboration and optimal allocation of resources between companies business departments. An additional aim is, to establish new competencies in the organization reaching a higher maturity level in data science projects.
Introduction to the ERCO use case
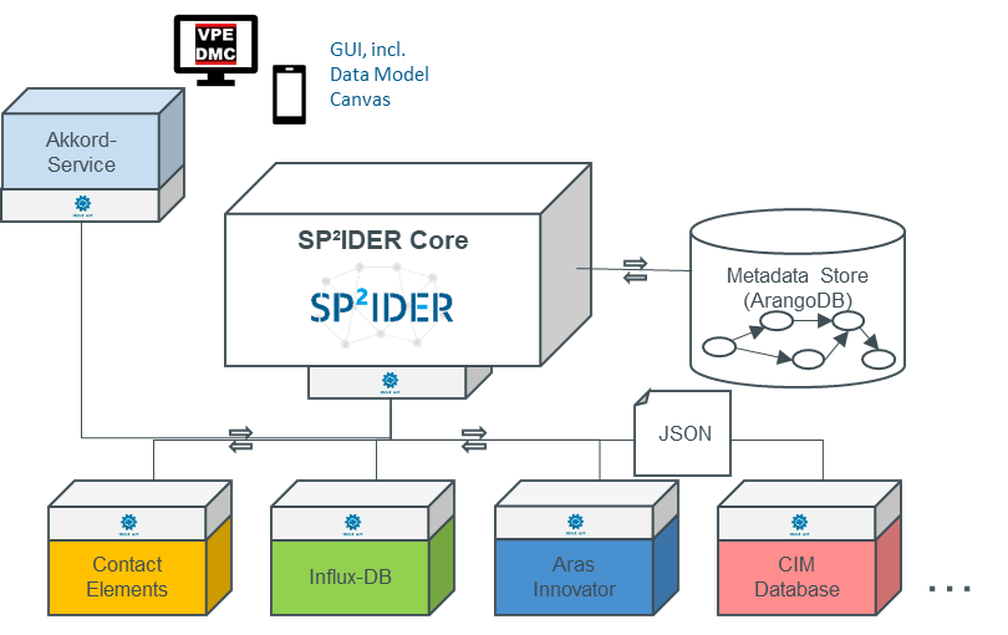
As so called application partner and medium-sized company ERCO fetches competencies in education, development and qualification of employees into the AKKORD research project. Additionally ERCO provides a highly integrated data network and the basic ability to apply analytic methods to manage the steering of a Supply Chain (Figure 1). ERCO wants to enrich information’s coming from quotations and orders, together with data from customer relationship management module (SAP CRM), to establish a prognosis based on algorithms. This forecast shall be completed with data from social media and “erco.com” content. The upraised data provides the basics for planning of company resources. Within the intercompany collaboration with sales organizations, production and assembly as well as supplier integration, the prognosis is a driving element of the supply chain. At this point, Rapid Miner AI software comes into the focus.
Figure 1: Procedure Use-Case 3
Approach to integral order prognosis based on market information
Order prognosis at ERCO is based on two pillars of data structures stored in the project opportunity, in SAP Customer Relationship System and the quotation data stored in the SAP ERP System.
ERCO Opportunities are created in combination with a milestone “projected order entry”. This date can change over the time, during the project development and will be maintained regularly. In combination with quotation data in SAP ERP, (product and quantity), we are able to determine the projected demand for a period of 4 months.
The projection of order entry is used to size the capacitive parameters of the ERCO production and as demand planning key figure, to align the supply chain in case of changes of market needs. The coordinating instance is the so called project & order center. Steering of supply chain is performed in close collaboration with external suppliers, purchase, preproduction, assembly as well as regional sales organizations.
Work status in integrated data analysis
The basic principle to establish a prognosis is the so called Cross-Industry Standard Process for Data Mining (CRISP-DM, Figure 2).
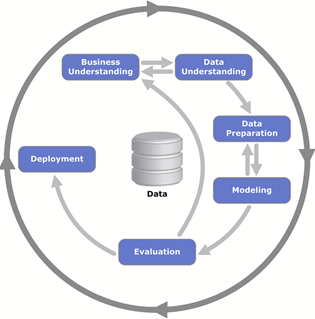
Figure 2: Cross Industry Standard Process for Data Mining
Applying this standard the starting point describes the definition of the business procedure in combination with a development of objectives to be reached. The development of the objective should take into account, that a use case based target can’t be reached by guarantee. Our use case of the integral order analysis was set up with a forecast precision of about +/- 20 % calculated on the real occurred order entry value in pieces. The company ERCO aims to cope with this volatility, taking capacitive and dispositive measures into account. The project scope was concentrated on three primary elements of CRISP-DM model:
1. Data Understanding
2. Data Preparation
3. Modeling
The three phases are subsequent data cleansing, preparation and an establishment of data dictionaries like conversion tables. At this point, the implementation of conversion modules for different entities like currency transition or date stamp extractions, will be a main focus. The invested time will shorten the duration of follow-up phases like modelling and evaluation.
The current phase of the research project is described by an intensive and regular evaluation of forecast results compared to the project aims. The experience shows that results derived out of the projection, must be interpreted in relation to the based business case.
Application of a time series based prediction model
The prediction of the order entry in quantity and value at a future date (week / month) will be applied using a time series analysis (Figure 3). Perquisition is a fixed given order of data and the consideration of the prediction as so called “Supervised-Learning-Model”. Using this model, we will predict the value of the output variable / target variable (Label) by a predefined quantity of input data. Basis for the Machine Learning are the historical input data of the four-month-window as well as the historical output data (real order entry in the time frame of the past four-month-window).
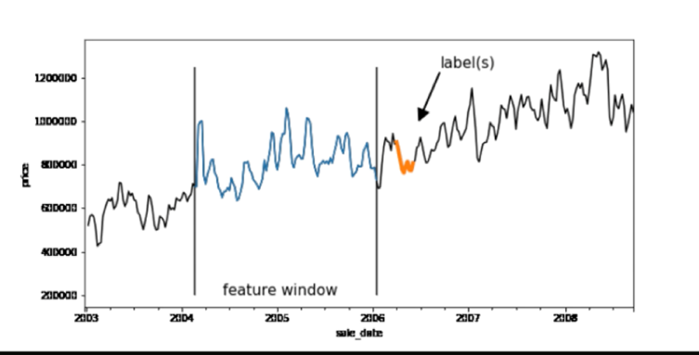
Figure 3: Time series analysis
The blue painted part of the graph represents the length of the time series as fundament for the training of the model. The orange painted area of the graph consists the time frame to be predicted. Three time series algorithms have been used to verify the prediction value in RapidMiner (Figure 5).
-Arima
-Holt-Winters
-Seasonal
During verification, the Holt-Winters algorithm showed the lowest deviation from the given target of +/- 20 % of the real order entry in quantity and value (Figure 4).
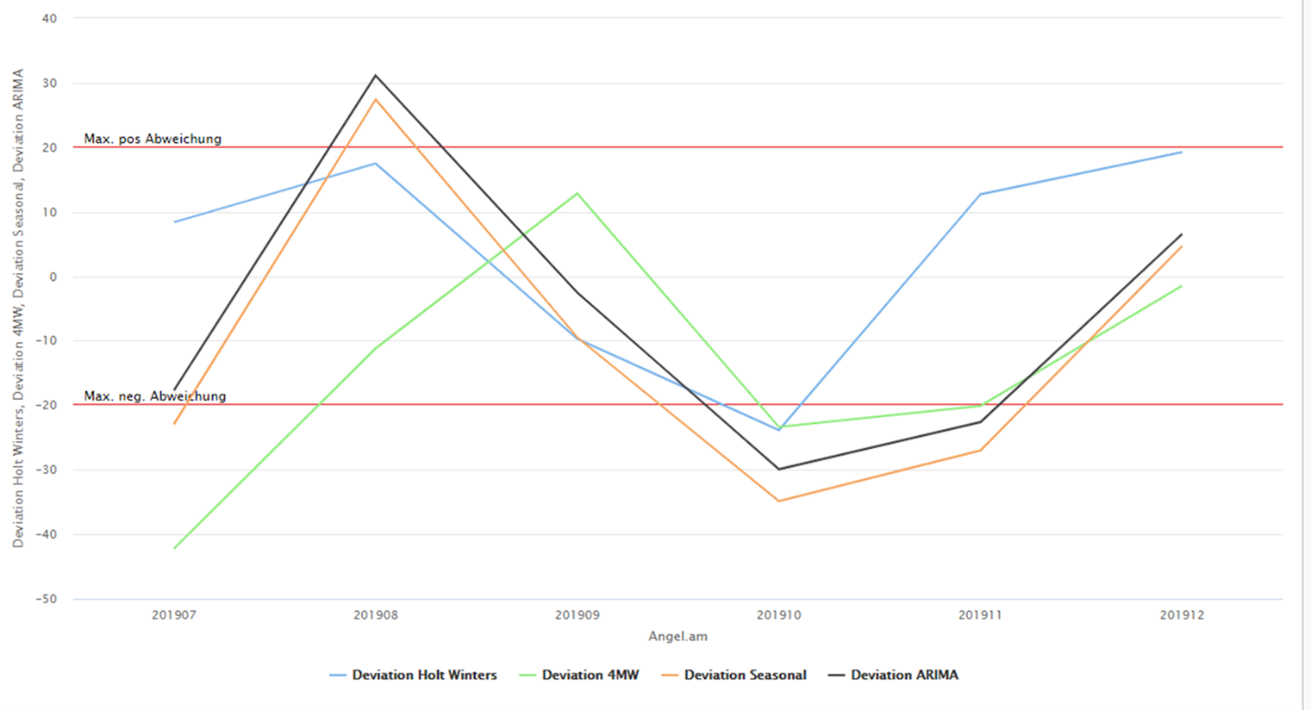
Figure 4: Graphical evaluation of the prediction models
The blue graph describes the max and min deviation from the Hilt-Winters algorithm results to the real order entry data. The algorithm has been selected for further optimization/validation.
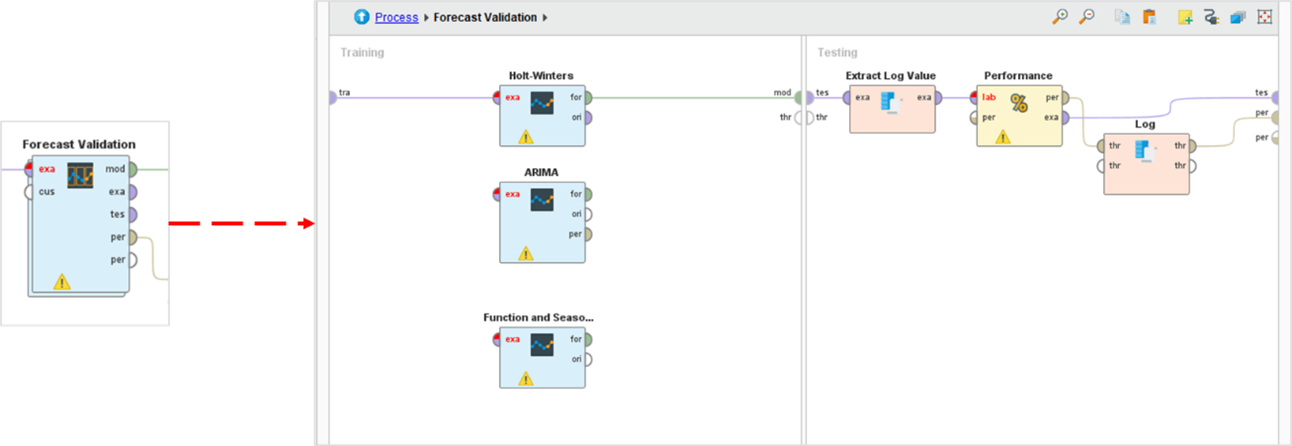
Figure 5: Process chain of the predictive models in RapidMiner Studio
During continuous validations we could not achieve further improvements after enrichment of information and data, extracted from the ERCO CRM. Reasonably the project team has applied the so called decision tree model for further investigation in the project.
Application of the decision tree analysis as prediction model
First results will be represented in a confusion matrix (Figure 6). The objective is to sustain the significance of the analysis in iterative steps of improving the indicators of the matrix:

Figure 6: Confusion Matrix
The following indicators are resulted out of the matrix:
Recall (Relationship of true classified placed orders between all true predicted orders) also described as rate of sensitivity, TP / (TP+FN)
Precision (Rate of correctly true classified values, describes the relevance and precision) TP / (TP + FP).
Accuracy (percentage of correctly classified values) correctly classified / all classifications. It describes the accuracy (hit rate) in relationship to the prior described target variable (label).
The following figure 7 shows the dependency between “precision” and “accuracy”
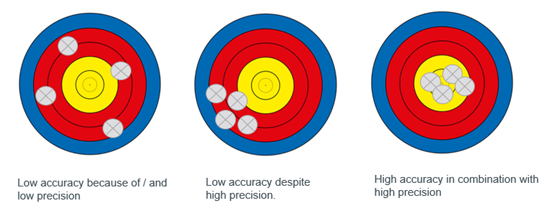
Figure 7: Graphical representation of precision and accuracy
The currently in the use case achieved indicators are shown in the figure 8:
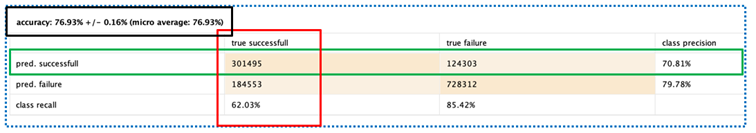
Figure 8: Indicators of the use case in the confusion matrix
The recall states around 62 % and the precision of correctly predicted order entries achieved the value 71 %. The accuracy has reached the value of 77 %.
At least the accuracy reached a higher level than the domain experience (belly feeling) which could be used subject to be deployed.
Next steps
The next steps consist of a regular application and analysis of actual current data using the established prediction modules and machine learning models in Rapid Miner Studio. Furthermore the next important step of the CRISP-DM module, the Deployment, will be realized.
Author and contact partner: