Publication on the use of graphical representations of information and data in Industrial Data Science projects released
The ongoing digitization in production is leading to constantly growing volumes of data. This data can contain valuable knowledge as the basis for numerous decision-making processes. Only through the targeted use of selected visualizations can a uniform and in-depth understanding of the data, processes, models and results be achieved for all members of the project team and for outsiders.
Publication on the use of graphical representations of information and data in Industrial Data Science projects
The publication is the result of the research work of the Institute for Production Systems (IPS) of the TU Dortmund University in the AKKORD project. The publication shows the specific benefits of various visualizations in the individual phases of IDS projects for communication and documentation.
Use of visualizations in the phases of Industrial Data Science projects
The Cross Industry Standard Process for Data Mining (CRISP-DM) is considered the standard for conducting industrial data analysis projects. The process consists of six iterative phases
- Business Understanding,
- Data Understanding,
- Data Preparation,
- Modeling,
- Evaluation and
- Deployment
together. Due to the multi-layered nature and complexity, the execution of IDS projects requires a cross-functional project team [see further this IPS contribution at the Industrial Data Science Conference 2019]. In addition to data specialists, such as data engineers, data analysts, and data managers, domain experts, e.g., process engineers and engineers, take on an important role in the project team due to their specific domain knowledge to ensure a continuous check of plausibility and usefulness of the project results.
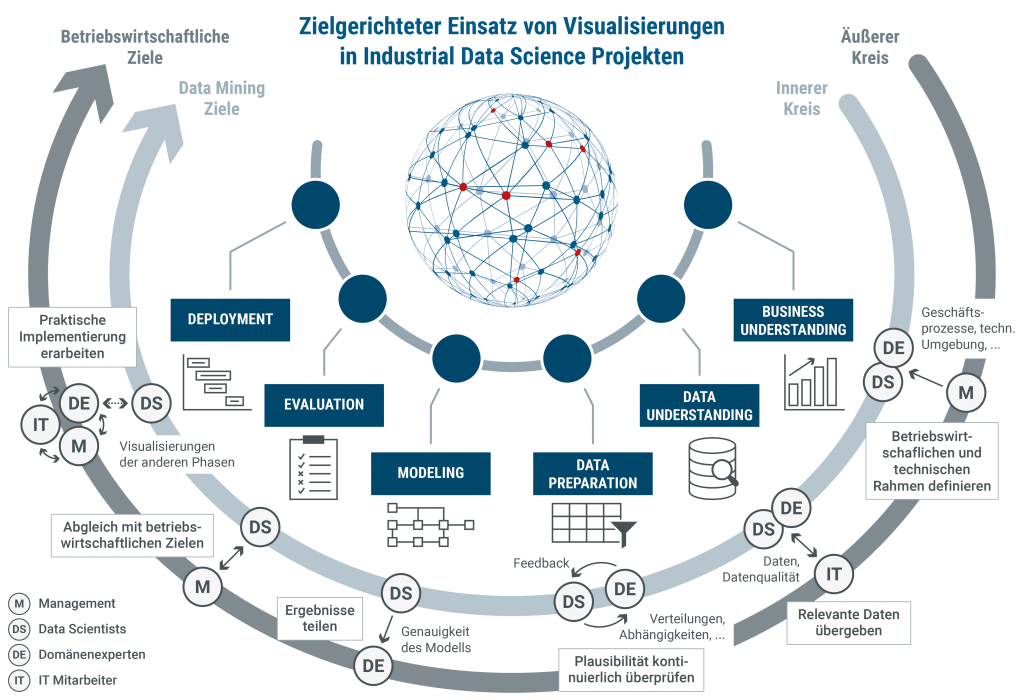
Figure 1: Targeted use of visualizations in IDS projects
In addition to the inner project circle represented by the project team, IDS projects often require communication with other groups of people, which are symbolized by the outer project circle (see above). These include the executive board and management, the specialist departments and adjacent areas affected by project implementation, such as the IT department for extracting data from IT systems and databases, and the works council for compliance with data protection rights when using personal data.
The figure also shows how the interaction and communication between the inner project circle and the various stakeholders of the outer project circle takes place in the individual phases of the CRISP-DM and connects operational as well as data mining goals. Visual support of the key information flows ensures that the specific tasks and objectives of the phases can be achieved according to plan and efficiently.
Utilization of different visualization forms for Industrial Data Science projects
In order to highlight central aspects and achieve added value in project-related communication and documentation, visualizations should be used in a context-specific and goal-oriented manner. An overview of the methods that can be used is shown in the following figure. In the different phases of IDS projects, the goals, contents, and communication needs in the inner and outer project circle determine the use of visualizations.
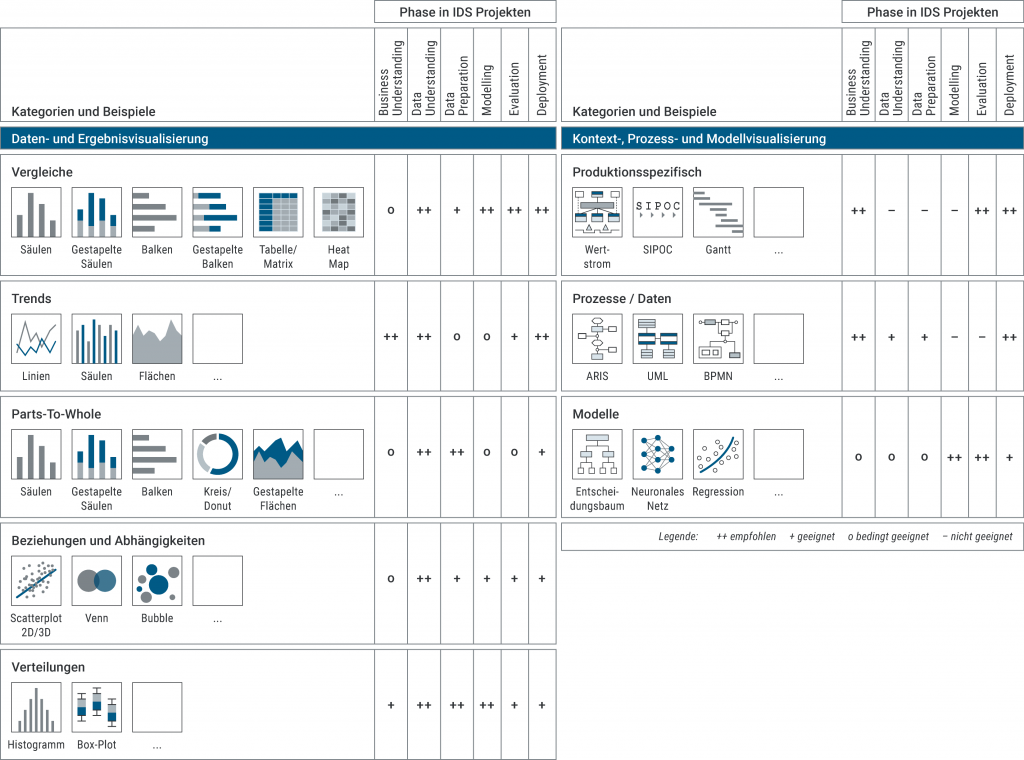
Figure 2: Benefits of visualizations in the phases of IDS projects
Further explanations on the possibilities for data and result visualization as well as context, process and model visualization can be found in the publication.
Summary and outlook on further research activities
Regular internal and external communication is an essential success factor for the implementation of Industrial Data Science projects. The targeted use of visualizations supports this communication through intuitive and technically independent representations of data, processes and models. The publication shows the benefits of different visualizations in the individual phases of IDS projects.
To support users in different tasks of a collaborative data analysis, a service platform for data analysis will be developed within our research project AKKORD. The platform will provide recommendations for appropriate visualizations that can be generated directly within the platform, shared with other analysts or domain experts, and deployed at different points in the data analysis process.
The full publication can be found here: https://shop.gito.de/de/arbeiten-in-der-digitalisierten-industrie-industrie-4-0-management-6-2020.html