Second Work Report from the research area “Analysis Modules and Configuration” – Integration and Visualization
The objective in the “Analysis modules and configuration” research area is to develop and implement partial solutions of the reference toolkit for value-creating, competence-oriented collaboration in value networks. This report describes the work status of the development of a module for the customizable, automated generation of analysis dashboards.
A contextual classification of the work in the reference toolkit
The AKKORD research project is divided into research areas in which the objectives of the project are developed. A summary overview of the four research areas in AKKORD can be found in this news article. Further information on the research project can be found in the kick-off publication and in the monthly work reports of all partners.
This report comes from the “Analysis Modules and Configuration” research area. Here, RapidMiner GmbH and the Institute for Production Systems (IPS) at the TU Dortmund University are leading the work on the required partial solutions of the analysis modules. The modular developments represent the core of the designed reference toolkit.
The last work report from the “Analysis modules and configuration” research area dealt with locating the work in the context of the reference toolkit. It also presented the three types of analysis modules that are realized with the help of module descriptions, catalogs and instructions.
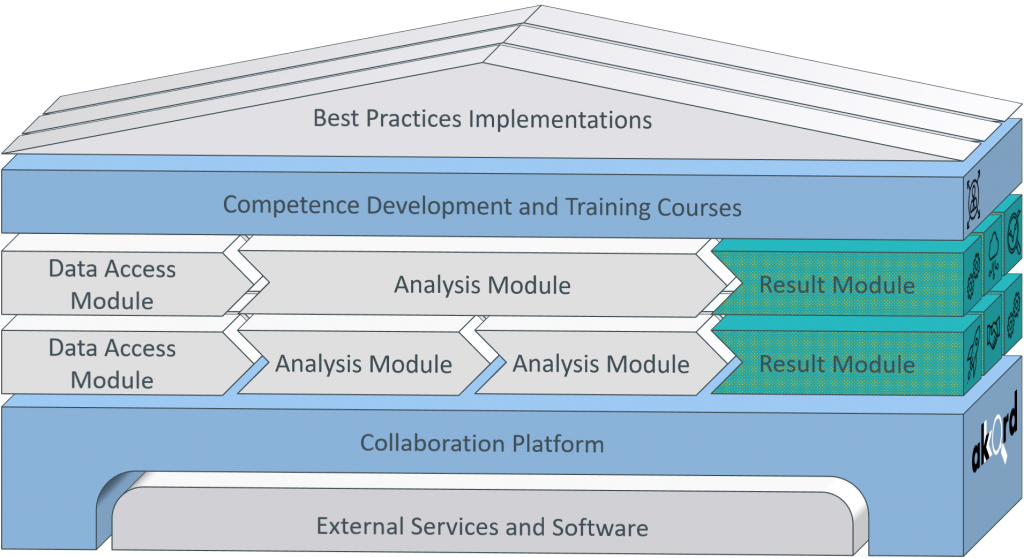
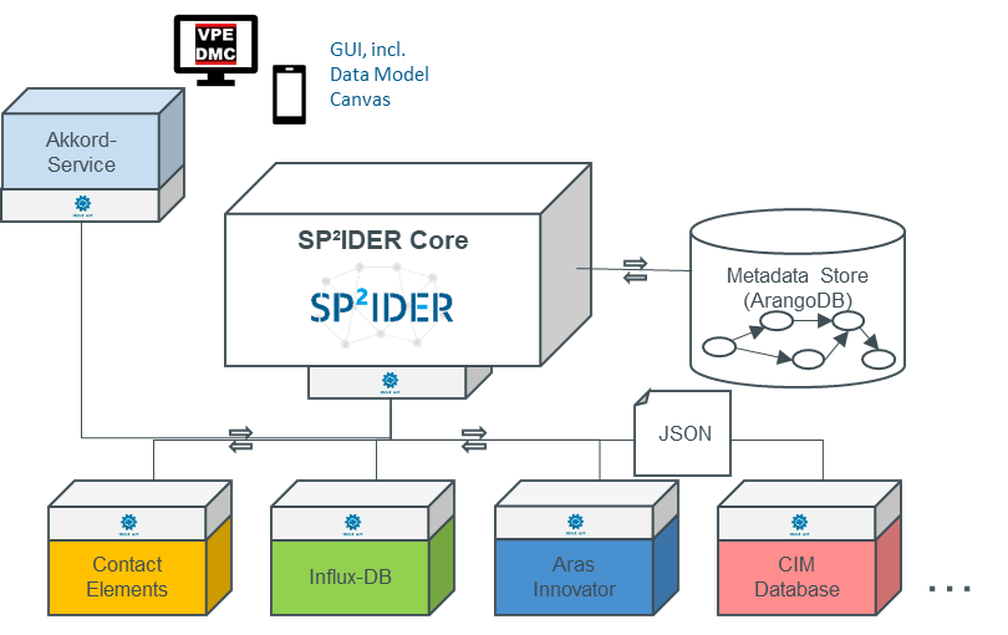
Figure 1: Localization in the reference toolkit
This report describes the progress of the work on the development of a module for the individualized, automated generation of analysis dashboards. As in the first work report, the results in this report are to be located within the framework of the reference toolkit. For this purpose, the following graphic shows the known processing status of the AKKORD reference toolkit, with the result level highlighted in color. This is where the analysis dashboard is conceptually located.
Objective of the module for individualized, automated generation of analysis dashboards
In the entire research project, the creation and application of modular modules for the practical implementation of Industrial Data Science projects is pursued. According to the reference toolkit, three types of modules will be developed for this purpose:
- Data access modules
- Analysis modules
- Result modules
Data access modules fulfill tasks for data connection and ensure consistent, efficient access to the necessary analysis data. Preconfigurable analysis modules provide the modular implementations for industrial data analyses, which means that only company-specific parameters need to be adapted. Result modules prepare the results of the analysis modules and make them available to end users in a meaningful form.
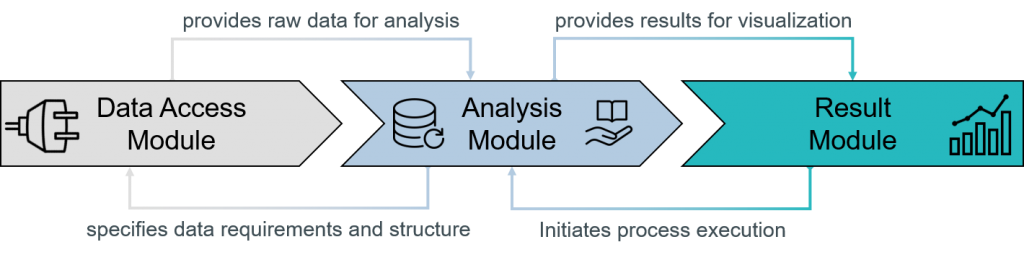
Figure 2: Configuration line
The development of a module for the individualized, automated generation of analysis dashboards is a separate partial work package in the research area “Analysis modules and configuration”. The result modules, that can be created with the AKKORD toolkit, are supposed to enable functions like result visualization, analysis process control, data upload and download as well as a model update as a practical and application-oriented user interface.
For the development of the result modules, the possibilities for linking to the analysis modules in particular are taken into account and coordinated. This will provide support for the efficient implementation of analysis modules in industrial processes. In this way, barriers to the use of data analysis technology are to be lowered, particularly for non-research-intensive small and medium-sized enterprises (SMEs).
Industrial need for visualization of analysis results
While the term Data Science describes the “extraction of information and knowledge from data“, Industrial Data Science deals with this task in industrial application areas. From an economic point of view, making analysis results usable through corresponding visualizations is absolutely necessary. Neither by a data acquisition and/or -attitude nor by a data analysis and/or -evaluation an economic use for the enterprises results.
Only through operational use can the analysis potentials be exploited and thus contribute to the achievement of business objectives.
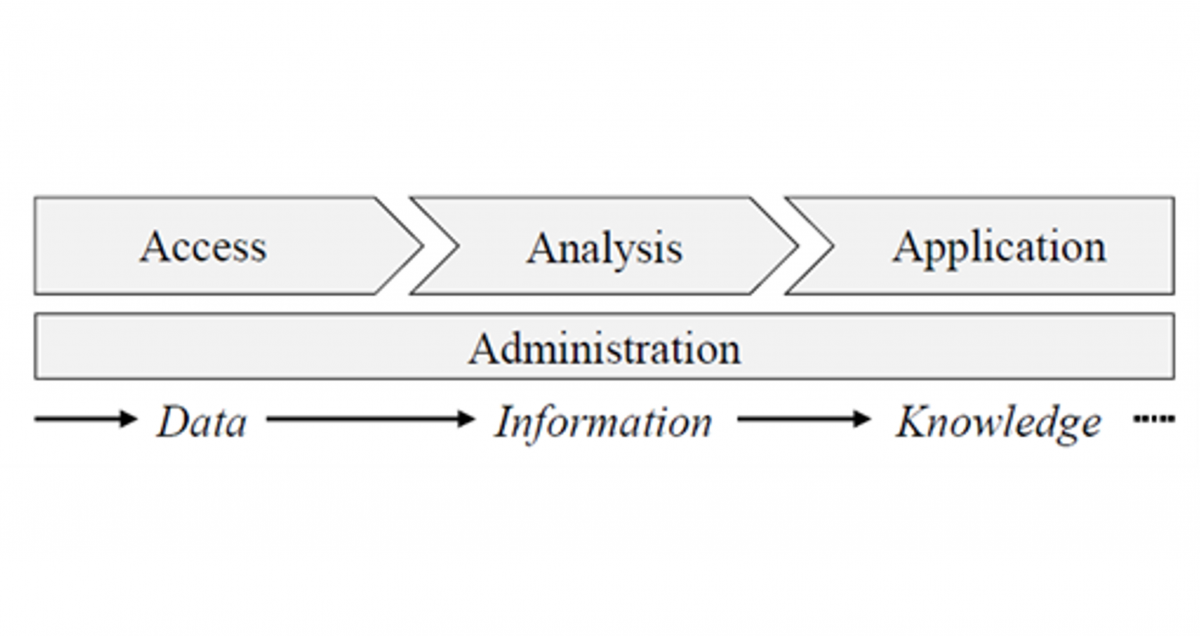
In the research project, user roles are defined that perform tasks in the reference toolkit. Three roles are necessary for the scenario of creating automated analysis dashboards. A distinction is made between the Module Creator, the Analyst and the Dashboard User. The Module Creator creates both analysis and visualization modules. The Analyst’s role is to parameterize the modules to fit the use case so that appropriate analysis results are displayed to the Dashboard User. Finally, the Dashboard User has the task of applying the analysis results and, if necessary, making slight adjustments to the parameterization of the visualization and analysis modules.
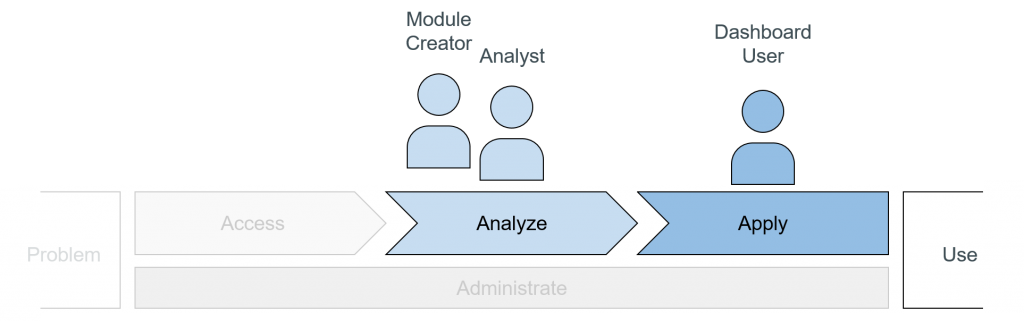
Figure 3: Roles in the dashboard configuration along the process chain of data analysis
Work status on the automated analysis dashboard
The analysis dashboards are based on dashboard templates with slots for visualization modules. These templates are based on a user survey of existing needs and dashboards already in use. The visualization modules fulfill the following functions:
- Data selection: Alternative connection of available data sources. Predefined data sources can be replaced temporarily or permanently by the Dashboard User.
- User input: restriction of the considered data range and selection of high-level analysis parameters.
- Prediction summary: Aggregated assessment of the displayed data set and its prediction (e.g. a KPI).
- Graphical visualization: display of plots or graphs.
- Tabular representation: representation of a data set by tables, typically the visualized data set.
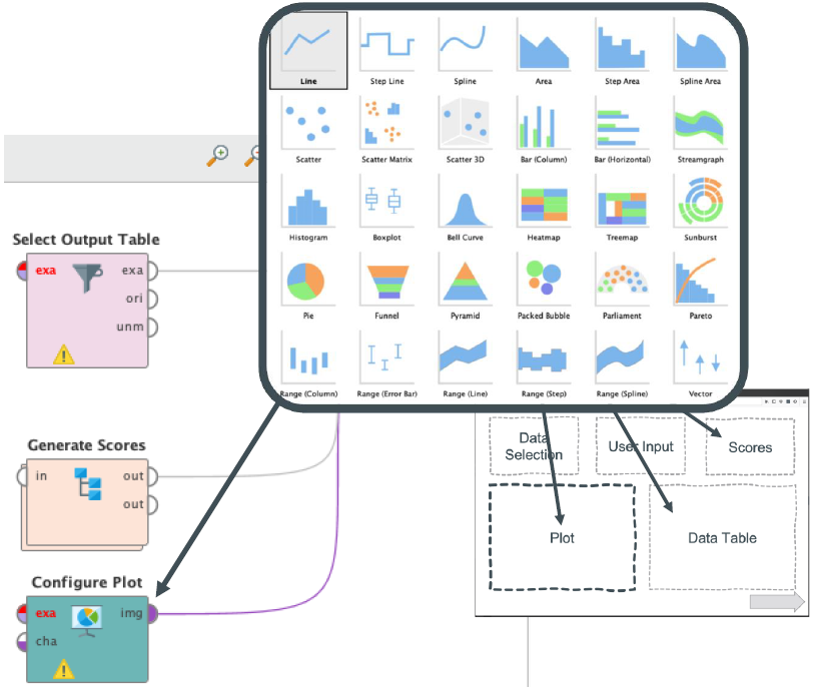
Figure 4: Concept graphic visualization
The following video shows the work status on the analysis dashboard.
The video shows the transition between the Analyst and the Dashboard User (transition at 2:00min). Here, the analysis is transitioned from an exploratory data environment (here RapidMiner Studio) to a deployment environment (here RapidMiner Real Time Scoring Agents). The starting point here is currently processes, data sources, and plot configurations that are bundled into a deployment. In the next step, this transition will be extended to ensure integration of the developed analysis modules. These bundle data requests, user inputs, and generalized analysis modules (e.g., consisting of RapidMiner processes, Python scripts, or similar) into an object that is configured by the analyst.
The prepared deployment resulting from the transition provides the starting point for the Dashboard User. He can choose between existing preconfigured dashboards. This is currently done by selecting a configuration file.
Once selected, the deployment is stored in an execution environment previously defined by the Analyst and is available as a backend for the visualizations in the dashboard. The Dashboard User then has the ability to switch between existing deployments, and interact with the analysis via the current five different visualization elements (2:28min).
Summary and outlook on further research objectives
The automated dashboard creation and the presented user support functions prepare the work on the user-oriented configuration assistant.
This assistant is intended to provide solutions for user-oriented and application-specific creation of analysis processes. With the completion of the work in the performance area at the end of the year, the analysis processes will be unified with the dashboard creation.
Further information and interim results will be published continuously on the AKKORD website and in the news articles.
Author and Contact Person: